Replication #9: MBH98 INSTRUMENTAL TEMPERATURE VERSIONS Script
Mann et al. have archived the following 4 instrumental versions of NH temperature history. The "dense" subset refers to the 1082 cell coverage; the "sparse" subset to the 219 cell subset. See Replication #2: Gridcell Selection. This sparse average is said to have been used in MBH98 in their calculation of verification statistics, such as RE. The instrumental data archived at the Corrigendum SI, said to have been used in MBH98, goes from 1854-1993. Some salient features of the 4 versions are shown below in Table 1:
| Coverage | Location | Name | Start | End | Significant Digits |
| Dense | NOAA (Sept. 17, 1998) | nhem-dense.dat | 1902 | 1998 (7 mo) | 1902-91 (7); 1992-98 (2) |
| Dense | NOAA (Jan. 22, 1999) | mannnhem.dat column 3 | 1902 | 1998 | 1902-91 (7); 1992-98 (2) |
| Dense | Corrigendum SI (July 2004) | nhmean.txt | 1902 | 1995 | 1902-91 (7); 1992-95 (2) |
| Sparse | NOAA (July 2, 1999) | nhem-sparse.dat | 1854 | 1993 | 1854-1993 (14!) |
1. a NH "dense" average from 1902-1998 archived at NOAA (Sept. 17, 1998) <ftp://ftp.ngdc.noaa.gov/paleo/paleocean/by_contributor/mann1998/nhem-dense.dat>.
2. NHObsTAnn (column 3) from 1902-1998 at < ftp://ftp.ngdc.noaa.gov/paleo/paleocean/by_contributor/mann1998/mannnhem.dat> at NOAA (Jan. 22, 1999) .
3. the "NH RAW" (column 3) from 1902 to 1995 at <http://www.nature.com/nature/journal/v430/n6995/extref/FigureData/nhmean.txt> archived at the Corrigendum SI (July 2004).
4. a NH "sparse" average from 1854-1993, archived at NOAA (July 2, 1999) <ftp://ftp.ngdc.noaa.gov/paleo/paleocean/by_contributor/mann1998/nhem-sparse.dat>.
Reference Period: No explicit information is provided in MBH98 or the archived information on the reference period for these data sets. By experiment, the 1902-1980 mean for the "dense" data series is 0 (for both instrumental and reconstructed versions.) This ties in with other zeroing of proxy series in MBH98. The 1902-1980 mean for the sparse instrumental series is close to 0 (-0.003), while the 1902-1980 mean for the sparse reconstruction series is exactly 0.
| Sparse Dataset Replication: The mask for 219 gridcells was applied to create a subset of the temperature dataset at the Corrigendum SI, an areal average taken of the NH cells and then an annual average; then the 1902-1980 mean was subtracted. These values were compared to the archived values at NOAA in \Figure 1 (at left) (correlation 0.9989), yielding very close replication. | 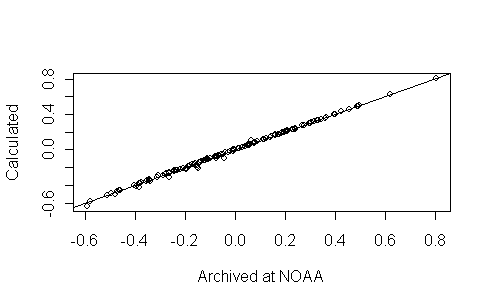 |
Dense Series Replication: I calculated the areal average for the dense subset for 1902-1993 from the Corrigendum SI temperature data set and obtained the results in the Figure below, which do not provide as close a replication as for the sparse data set, although there is still a high correlation between the results. There are also the curious discrepancy in end of period: here the reported series ends in 1995 (and even 1998), plus the puzzling changes in digit practice from 1992 on. It seems possible that a different edition of the temperature data set was used here. Note the discrepancy in MBH98 on when the temperature dataset ends: MBH98 refers to using 1128 months from 1902-1995, but the Corrigendum SI provides a dataset ending in 1993.
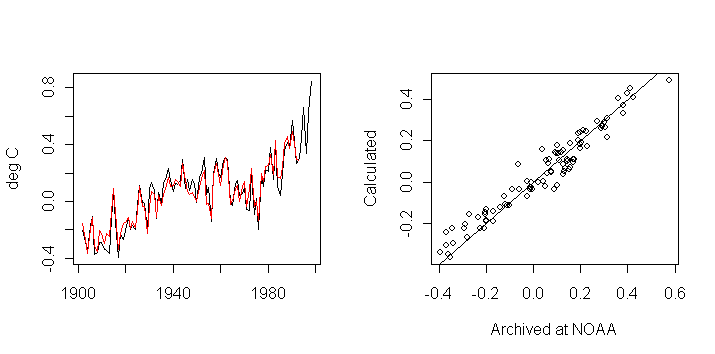
Figure 2. NH "Dense" Instrumental : Left: Black: archived NOAA (dense); red - calculated from Corrigendum SI temperature data set, re-zeroing to 1902-1980. Right - scatterplot of archived NOAA and calculated from Corrgiendum SI temperature dataset.
Some obvious questions which I am unable to answer:
(1) Obviously anomalies-new at the Corrigendum SI cannot be the source of the post-1993 data: what is the source?
(2) Was the source of the post-1993 data also used to over-write 1992-93 data from anomalies-new?
(3) What accounts for the difference between replication of dense and sparse datasets?